
Course Rationale
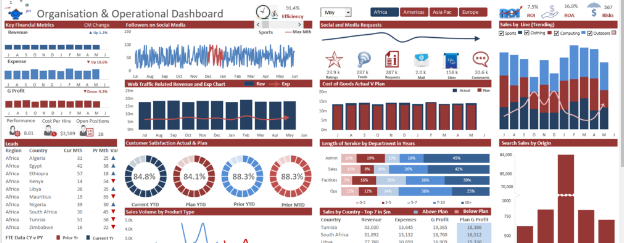
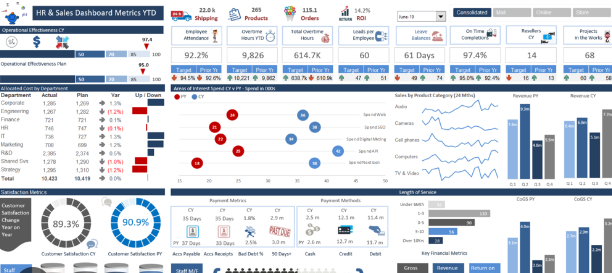
An Excel Dashboard provides insight, analysis and alerts. They’re fully interactive and dynamic and can help with project management, customer service, retail management, financial forecasting and much more.
Take your Excel skills to a whole new level by learning to build dynamic Excel dashboards to present your KPIs. This course will teach you the data analysis & visualization skills you need, to design well-designed dashboards in Excel. Bring the magic of Excel in your work by creating beautiful, functional and interactive Excel dashboards.
Key Features:
- Usually fits on one page
- Displays key trends, comparisons and data graphically or in small tables
- Provides the reader with conclusions to their objective
- Is often interactive allowing the user to filter data and switch views themselves
- Employs best practices that enable the report to be updated quickly and easily (often at the click of just one button)
Learining Outcomes
After the workshop, you will be able to:
- Able to produce high quality interactive dashboards
- Master the art of charting and visualizations
- Become more proficient in using complex Excel data analysis and reporting features
Who this course is for
- Data analysts
- Business Professionals who use Excel to create dashboards and reports
- You currently use Excel and want to improve your skills
- You’d like to learn how to create interactive reports
Course contents
- Introduction
- Data Preparation
- Design Principles
- PivotTables for Analysis
- Pivot Charts
- Slicers
- Updating Pivot Based Dashboards
- Formulas for Analysis
- Regular Charts
- Form Controls
- Slicers for Formulas
- Updating Formula Based Dashboards
- Distributing Dashboards
- Protecting Excel Files
- Embed in PowerPoint
- Excel Web App
- SharePoint Page
- Custom Passworded Views
- Choosing Charts
- Create Regular Charts from PivotTables
- Adding Series to Charts
- Charts & Tricks for Trending
- Smoothing Data
- Actual vs Target Charts
- Bullet Charts
- Small Multiples & Panel Charts
- Dot Plots, Dumbbells & Lollipops
- Highlight Chart Min & Max
- Frequency Distribution
- Sparklines & Mini Charts
- Map Charts (2019/2021/365)
- Conditional Formatting
- Heatmaps
- Visualizing Parts to a Whole
- Symbols in Charts
- Dynamic Labels
- Lookup Charts
- Cross Filter & Highlight
- Scroll and Sort Table
- Chart Titles
- Custom Number Formats
- Tabs Using Shapes & Hyperlinks
- Formatting & Chart Alignment Tricks